keywords: Spatial data, GIS Analyst, ArcGIS Desktop, GIS Remote Sensing
How do you calculate NDVI in ArcGIS?
What is NDVI?
The Normalized Difference Vegetation Indices (NDVI) is an index that measures the amount of green vegetation on Earth’s surface. NDVI calculation requires two bands (Red and Near-Infrared) of satellite data. This tutorial will show how to calculate the NDVI for each pixel in a raster layer.
NDVI Calculation in Arcmap in less than a second
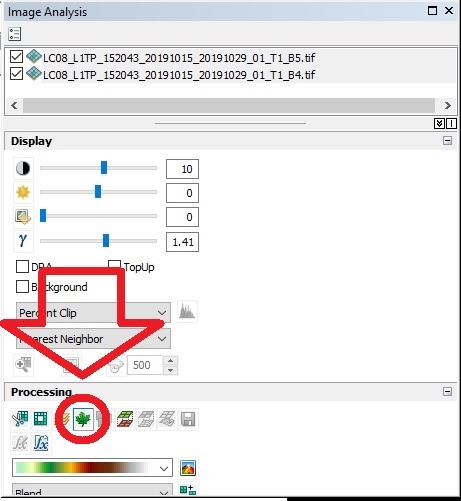
This tutorial will help GIS Analysts in calculating the NDVI (Normalized Difference Vegetation Index) by using Automation tools in the ArcGIS desktop. There are QGIS plugins also available for calculating NDVI. Also, there’s now a button in the ArcMap 10 onwards series for calculating NDVI in the image analysis window.
NDVI Calculation in ArcGIS Model builder
To calculate the NDVI in Arcmap, we must first add the image into a raster format. To do so, we can use the add-data option. We can use the ArcMap model builder to calculate the NDVI.
In this tutorial, you will be learning to create your own NDVI model as your first step in learning GIS Automation. Automation is a dream come true for new GIS specialists. The ArcGis tools are used in the Arcmap for the purpose of automation in ArcGIS Desktop.
The model builder in ArcGIS desktop is a tool for non-developers or the kind of people that do not want to code. ArcGIS model builder is a helpful tool for those who don’t have any programming experience and want to automate some complex workflows in GIS. Watch the below video for a complete tutorial on Calculating NDVI using Arcmap Model Builder. I also made a much more complex tool in Arcmap Model builder that calculates Land Surface Temperature from Landsat 8 OLI/TIRS or Landsat 5 MSS. You can contact me anytime or email me for the tool.
Want to hire me as your GIS Analyst?
Benefits of using ArcMap Automation Toolbox (Model Builder):
- This tool can help you build complex workflows like calculating Land Surface Temperature LST.
- You can make changes according to your needs even after running the tool.
- It is easily shareable with any other GIS Specialists around the world.
- It increases the transparency in the geospatial process for a more accurate workflow.
- It also reduces the errors you might see in the middle of the workflow that distracts the whole process and wastes time.
- It also saves a lot of time by not looking for the tools again and again in the spatial analyst window.
- If you are working for a client as a freelancer, then this is an ideal tool for sharing your process.
KML to shapefile conversion tutorial was the previous post. Wanna have a look?
How is NDVI calculated? What is NDVI – Calculating formula
NDVI is the most common and usually the first algorithm used by GIS and Remote Analysts for getting the idea of green spaces such as Vegetation in any satellite imagery. It can be calculated by using two satellite imageries, Red band (Visible Region) and Infrared Band (invisible region). This video tutorial is using two bands of Landsat 8 OLI/TIRS Satellite. The location of the imagery is Karachi, Pakistan (My city where I live). NIR Band in Landsat 8 OLI/TIRS is the 5th, and the Red band is the 4th. The satellite band numberings can be different from satellite to satellite.
NDVI = (NIR-RED)/(NIR+RED)
The final image pixel values must range from -1 to +1. For the value of NDVI to be from 0 to 100, you need to adjust the formula a bit like this.
NDVI = (NIR-RED)/(NIR+RED)*100
Learn Data Science and Coding with GIS Analyst – Huzaifa Mukhtiar
Want to write about GIS on our website? contact us here